CLIMATE INTELLIGENCE AND MONITORING · BY ASSET
Price, plan and provision with your asset's actual risk. Not the state average
i4climate monitors the exposure, vulnerability and climate hazards of every asset in your portfolio, operation or city with proprietary climate intelligence, and translates that risk into financial impact you can use to price, plan and provision. The risk hidden by the state average is exactly the risk that defines your loss.
1 asset or region analyzed in 7 days, at no cost and no commitment
- 100+ assets analyzed across Latin America
- 10+ years of climate operations on real assets
- 18 climate hazards covered
Exposure by asset
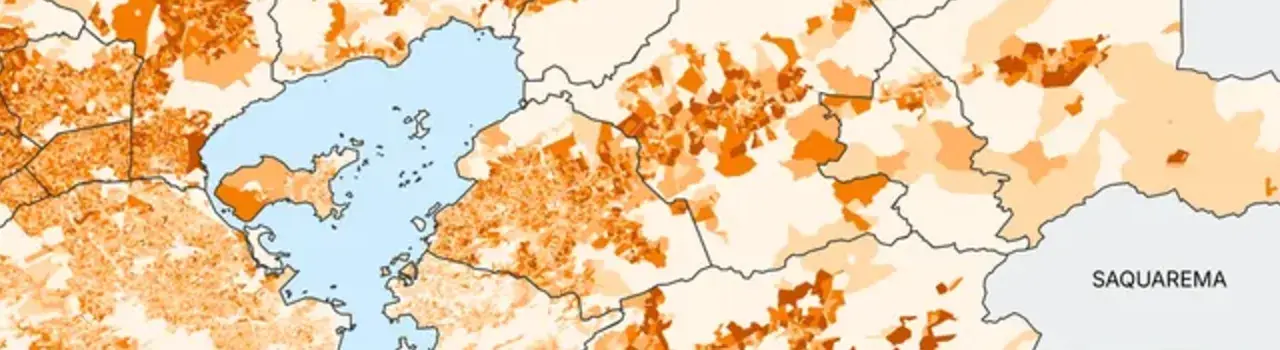 Risk score8.4 · high
| Hazard | 2027 | 2032 | 2050 |
|---|---|---|---|
| Flooding | Medium | High | Very high |
| Windstorm | Low | Medium | Medium |
| Extreme heat | Low | Medium | High |
SSP2-4.5 scenario · 1-3 km resolution · source, method and assumption on record
Climate risk is already on your books. It's just not in your price
Only 8 to 9% of Latin America's natural catastrophe risk is covered by insurance: almost everything the region stands to lose today is unprotected. And 3 out of 4 financial institutions in the region don't trust the data they have to measure that risk. Flooding, drought, windstorms and extreme heat already hit your bottom line every year, as claims, emergency works, crop losses, or a provision nobody can defend. The event will happen and it will cost you. The risk exists. It just isn't priced. And when it is, it was priced with country or state-level statistics, not the real risk of your asset portfolio or operation.
Price
Whoever prices with the regional average gets it wrong both ways: overcharging the protected and undercharging the exposed. The portfolio ends up concentrating exactly the risk the model missed.
Planning
Whoever plans a city, infrastructure or a harvest with generic data invests prevention where it isn't needed and discovers the real vulnerability on the day of the event, with lives and budget on the line.
Balance sheet
Whoever needs to book the risk in the results has no number that finance will sign off on and audit will accept. The risk stays a qualitative footnote, invisible to the cost of capital and to investment decisions.
i4climate exists to turn these three blind spots into a defensible number.
FROM HAZARD MAP TO BALANCE-SHEET NUMBER
See the risk before it becomes a loss. Defend the number in front of anyone who audits it
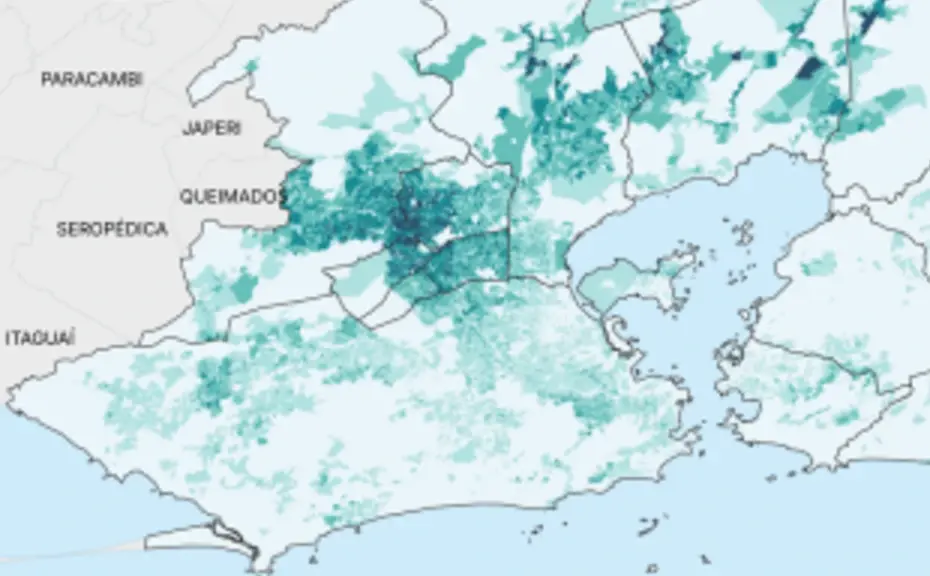
A single analysis delivers what every desk needs to decide, on the same number.
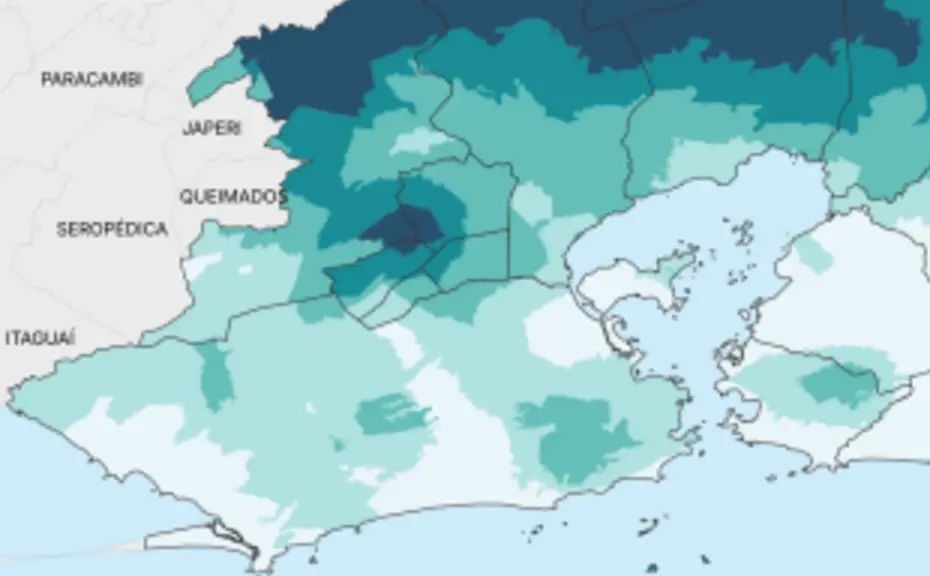
Flooding across the territory, regardless of who is there and of economic aspects.
The same hazard crossed with social, environmental and economic aspects.
Start with the picture. Move up to the balance sheet
Three steps. Each answers a question the previous one opens.
STEP 1
What has climate already cost here?
Climatological picture and past financial and operational impacts of your asset, area or monitored region. This is the baseline: what already happened, how often, and how much it cost.
Starting at US$ 1,000
per asset, location or monitored area
- Hazard history
- Past impacts
- Baseline by asset
STEP 2
What will climate cost, and how do I defend that number?
AI-driven, hyperlocal future climate risk by asset, with IPCC scenarios out to 2075, and auditable impact ready for finance, risk management and audit. This is the step that changes the decision: price, plan and provision start looking forward.
Starting at US$ 7,000
per asset, location or monitored area
- Future risks
- Scenarios to 2075
- Auditable impact
STEP 3
How much of this turns into money in my results?
Full translation of impacts into financial terms: expected losses, avoided losses, gains and provisions, integrated into your decision process. For portfolios and multi-asset operations.
Custom quote
sized to the portfolio
- Gains and losses in dollars
- Provision
- Portfolio-level
All three steps run on the same data engine. You enter at the step that answers today's question and move up without redoing work.
Get my free diagnosticFrom coordinate to the number finance signs off on, in five steps
- 01
Inventory
Every asset enters with coordinates, operation type and critical variables. Without an inventory, the report describes a region. With it, it describes your asset.
- 02
Cross-referencing
The asset's proprietary climate history is cross-referenced with IPCC projections, using the same scenarios regulators and banks treat as reference.
- 03
Exposure, vulnerability and sensitivity
Every hazard is quantified by asset, by horizon and by scenario. This is the step that turns climate into measurable risk.
- 04
Financial translation
Risk becomes an impact in dollars, in a format finance, risk management, claims and audit can use and defend.
- 05
Continuous update
The report isn't a snapshot. As the climate baseline advances, the number moves with it, with source, method and assumption on record.
The level of detail that separates the exposed asset from the protected one
Global climate risk platforms describe the planet in 25 to 100 km grids. At that scale, two points a few kilometers apart, with completely different risk profiles, get the exact same number. i4climate runs on proprietary data calibrated for all of Latin America, including Brazil, at 1 to 3 km resolution: the level of detail that makes that difference show up on the map. At that level of detail, every asset pays for the risk it actually carries, instead of the low-risk client subsidizing the high-risk one. The city plans without guessing. The provision comes out without surprises.
| What you decide | 25-100 kmWith 25-100 km global data | 1-3 kmWith i4climate |
|---|---|---|
| Policy or credit pricing | With global dataRegional average, diluted risk | With i4climatePortfolio risk down to 1-3 km |
| City prevention planning | With global dataCountry or state-level statistics | With i4climateVulnerability by neighborhood and infrastructure |
| Agri sourcing and origination | With global dataTrend by macroregion | With i4climateHazard by producing locality, with scenarios |
| Provisioning and disclosure | With global dataQualitative footnote | With i4climateImpact in dollars, with source, method and assumption |
- 100+ assets analyzed across Latin America
- 10+ years of continuous climate operations
- 18 chronic and acute climate hazards
Whoever measures risk by asset decides first
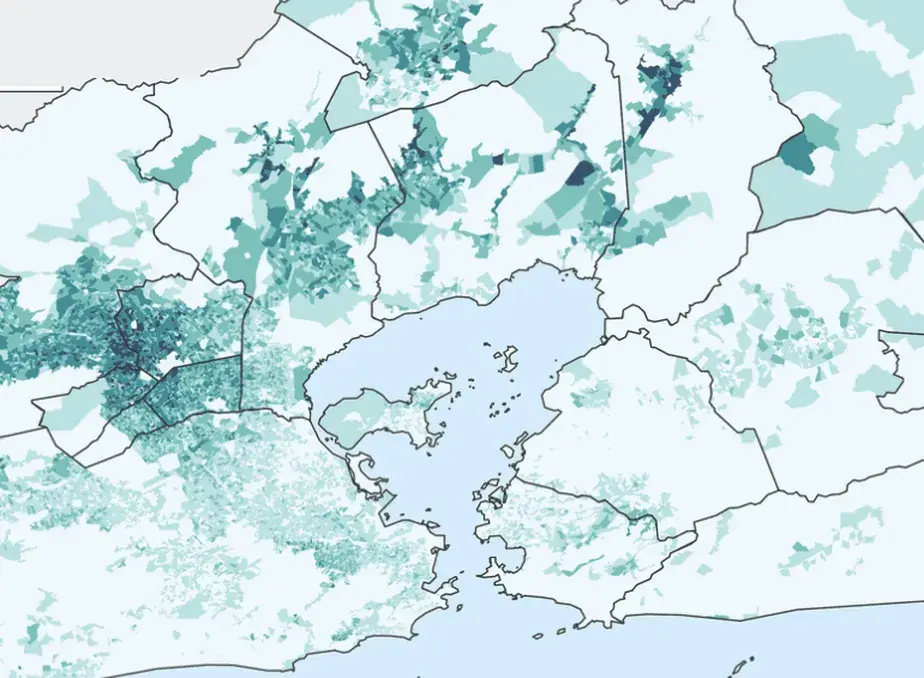
WINDSTORM AND FLOODING · METROPOLITAN REGION
The detail the regional average hides
- 26,510
- Census tracts analyzed, one by one. Smaller than a neighborhood, the smallest unit of territory that exists.
- 7x
- The flood risk in one municipality of the region, compared to the region's own average.
- 45.7%
- Of tracts (12,123 of 26,510 analyzed) already have high or very high vulnerability to windstorms.
In 7 days, the risk of 1 asset or region. At no cost
- 1
You point us to the asset or region
A coordinate, a municipality, a slice of the portfolio. 5-field form, 2 minutes.
- 2
We analyze it
Exposure, vulnerability and climate hazards for the point you indicated, using the same data engine behind the full reports.
- 3
You receive it and review it with us
Pilot report in 7 days and a 30-minute call to walk through the results. No commitment.
1 asset or region analyzed in 7 days, at no cost and no commitment
Questions we hear before every decision
You decide on your asset, not on the average. In practice: the insurer separates the exposed policy from the protected one within the same city; the city government knows which neighborhood and which infrastructure to prioritize; the trading company tells apart producing regions that global data treats as identical; the bank sees the risk of the financed asset, not of the country. Resolution isn't the benefit. It's what makes the benefit possible.
It depends on the step. In the first, a picture of what climate has already cost the asset. In the second, future risks with scenarios out to 2075 and impact in an auditable format. In the third, a full translation into losses, gains and provisions for the portfolio. Every step ships with source, method and assumption on record.
Yes, when you need it to. The region is moving toward ISSB standards (IFRS S1/S2) at different speeds by country: already mandatory in Mexico (CNBV, for all BMV-listed issuers since 2026) and in Chile (CMF, since 2021, with NCG 519 bridging to IFRS S1/S2); approved in Peru in March 2026, with mandatory reporting only from 2029. For banks, each national regulator keeps its own climate-risk prudential roadmap. But the product doesn't come from the regulator: it comes from price, plan and provision. The report is one of its outputs, not the reason it exists.
Yes, and the difference shows up in the money. Portfolio-level analysis calculates the average across the book, useful for an aggregate view. Per asset, every point has its own number, and the sum reveals where the portfolio concentrates risk that the average dilutes. i4climate delivers both: the asset to decide case by case, the aggregate to decide the portfolio.
The free diagnostic: 7 days for 1 asset or region. Full reports: days to a few weeks depending on the number of assets, not the months of a consulting project. Updates after that are continuous.
Global platforms are calibrated for the world, with finer resolution in North America and Europe. For Latin America, including Brazil, they deliver the average this product exists to beat. i4climate combines the same scenario standard global regulators use with 10+ years of proprietary data calibrated for the region.
The next climate event is going to cost you. The question is whether it's in your price
Whoever measures risk by asset prices better, plans earlier and provisions without surprises. Start with the free diagnostic: 1 asset or region, in 7 days, no commitment.
100+ assets analyzed · 10+ years of climate operations · all of Latin America