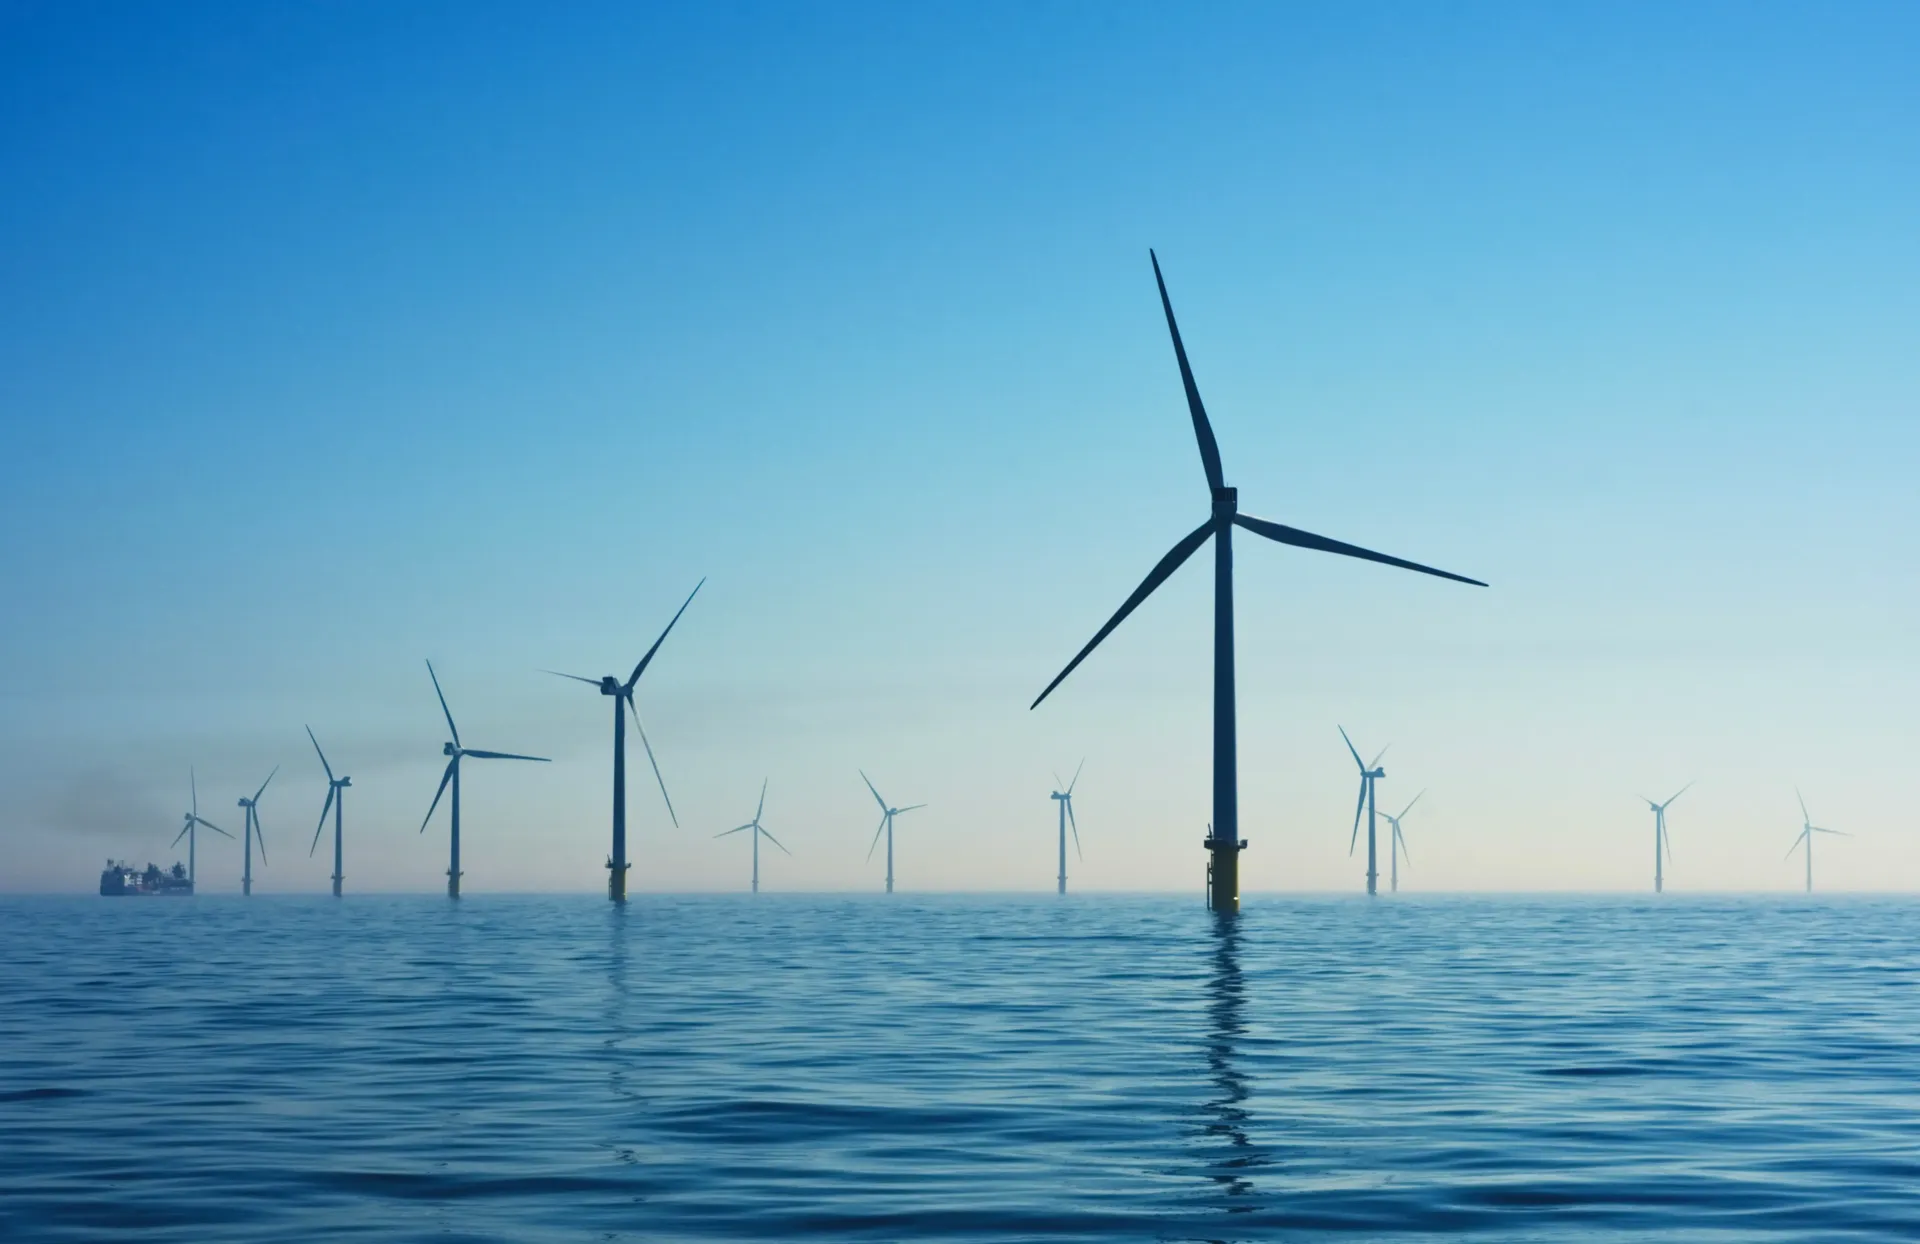
ENERGY · WIND · SOLAR · HYDRO
Generation doesn't stop by chance. It stops for lightning, windstorms and storms.
Lightning, icing risk, windstorms, storms. Anticipate hazards, protect assets and maximize generation and maintenance windows.
+10,000 actionable alerts per year applied to real decisions


Weather is the biggest unmanaged risk in renewables operations
78 million
lightning strikes per year in Brazil. The country with the highest strike incidence in the world operates the 5th largest wind fleet, most of it without hyperlocal monitoring.
US$ 100M/year
in lightning damage to wind farms globally. Lightning strikes account for 60% of blade losses.
30 hours
of average downtime per lightning incident on a turbine. A single strike can take a machine offline for more than a day.
Lightning, wind above the turbine's safe limit, sudden swings in generation, ice on the blades. In every case, the event arrived before the decision.
The decision before the lightning, the gust and the swell

Hazard anticipation per turbine
Know in advance when lightning, gusts above the safe limit, sudden wind swings (ramp events) and swell will hit each turbine. It's not "storm in the Northeast". It's "turbine 47, high lightning-strike risk between 2 PM and 6 PM".
- Lightning
- Gusts
- Swell
- Icing
- Per turbine

More precise maintenance and generation windows
Every alert translates windstorms, icing, lightning and visibility into safe maintenance windows. The O&M manager sees when to mobilize crews and when to maximize generation.
- O&M optimization
- Lower cost from unnecessary trips
- Fewer unplanned stops

Direct integration with the operations center
Integration via API, WhatsApp, Teams, SMS and email. The operator doesn't get a weather bulletin. They get whether to shut down, hold, or mobilize a crew.
- API
- Teams
- Protocols by alert level
The next climate event costs more than monitoring it.
You can't control the weather, but you must manage the risks
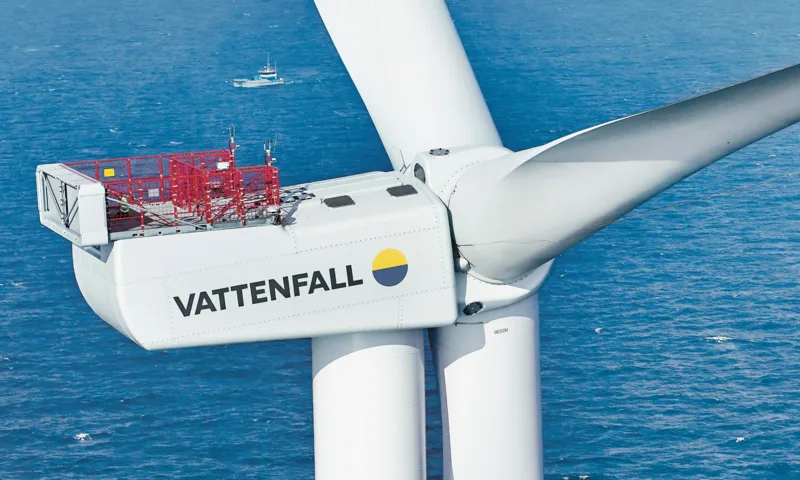

Vattenfall
The result when the decision comes before the event
27x
of proven ROI vs global forecasting model
Hyperlocal per-turbine forecasting generated 27.49 times more accumulated operational value than the global ECMWF model.
Questions we hear before every decision
The next climate event costs more than monitoring it.
You can't control the weather, but you must manage the risks
Each turbine is registered as a monitored asset, with coordinates, hub height and history. The model crosses hyperlocal forecasting with operational limits and proprietary reanalysis to generate turbine-specific alerts.
It depends on the phenomenon:
- Lightning / gusts above cut-out: 1–6 h
- Ramp events / storms: 6–120 h
- Cold fronts, cyclones: 3–10 days
- Nowcasting (imminent strike): 15 min–2 h
Yes. Each turbine has its own rules and levels. You define what's critical (a turbine on a hilltop, at the edge of the farm, offshore) and receive individual alerts.
Yes. We deliver via REST API, WhatsApp, Teams, SMS and email. For integration with SCADA and fleet management systems, we configure webhooks during onboarding.
3 weeks, in 3 stages:
- Mapping of critical assets (turbines, substations, evacuation lines)
- Calibration with event history and the farm's operational limits
- Configuration of alerts, channels and training of the O&M team
We use radars, weather stations and wave buoys to correct the numerical forecasts and generate extremely accurate AI forecasts with up to 48 hours of lead time.
We cross hyperlocal forecasting × the fingerprint of weather events × the farm's operational thresholds. The result is calibrated probability per turbine: "region 47, high lightning-strike risk between 2 PM and 6 PM. Shutdown protocol recommended."
Lightning strikes · gusts above cut-out · ramp events · severe storms · hail · ice on the blades · heat waves (degradation) · extratropical cyclones · reduced visibility.
The cost of i4cast is a fraction of the loss from a single lightning incident. A turbine stopped by a strike costs on average 30h of downtime + blade repair. The monitoring pays for itself on the first anticipated event.
Three main differences: (1) 100+ AI scenarios at 1 km to 3 km resolution per turbine, not generic forecasts by region. (2) We enter your process and language: we deliver stoppage probability and maintenance window, not a wind map. The operator receives action, not raw data. (3) Evidence: an auditable trail per event for reports, insurance and compliance. Traditional providers deliver a bulletin; we deliver operational climate intelligence.
- 100+ AI scenarios
- Risk language
- Evidence trail