ENERGY · TRANSMISSION · DISTRIBUTION
A weather-driven outage is not a rare event. It's routine.
In transmission, 39% of outages already come from weather. In distribution, storms, lightning and windstorms drive DEC and FEC. Anticipate the risk per span, feeder and critical asset, and stage crews before the interruption.
+10,000 actionable alerts per year applied to real decisions


Weather already brings down lines and networks, and impacts crews in the field.
39%
of transmission-line outages in 2025 were caused by weather events.
R$ 165M
in ANEEL fines for a single storm. 2.1 million people went without power for 7 days.
176,169 km
of transmission lines exposed to extreme events in Brazil.
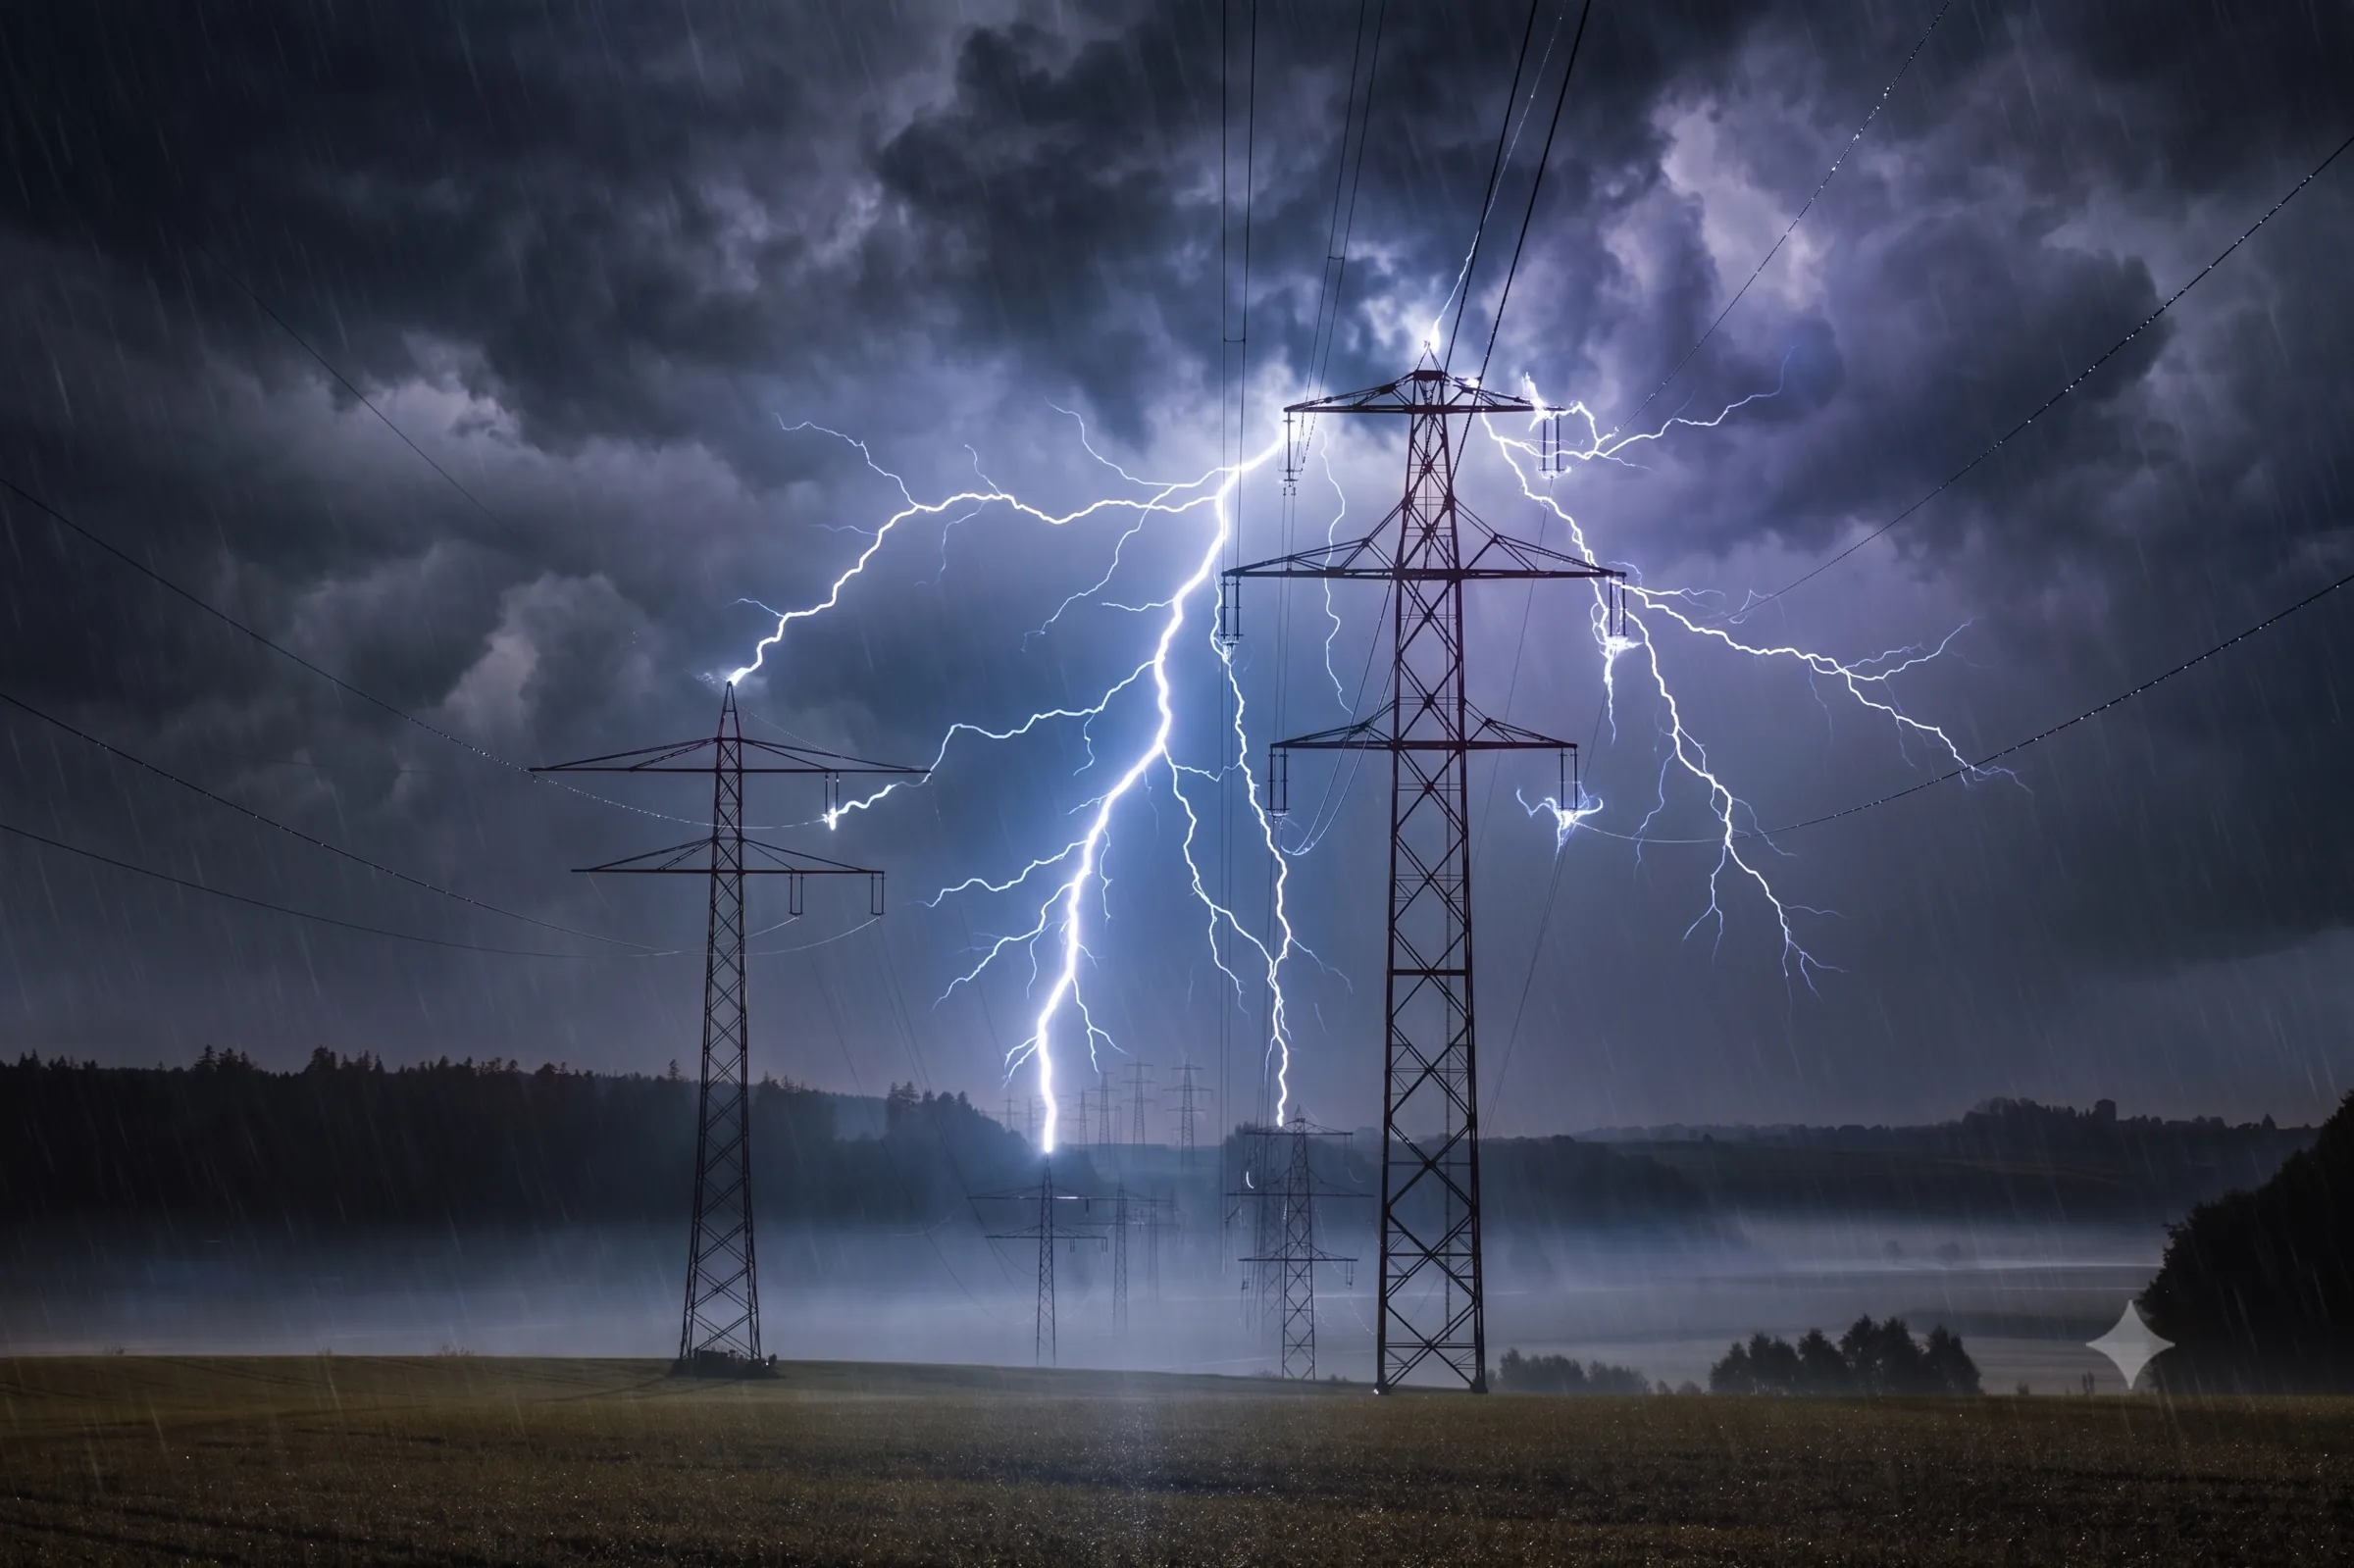
Lightning strike, fires, windstorm, storm. In every case, the event arrived before the decision.
Decide before the line, the network or the substation goes down.

Risk per asset, not generic forecasts by city
Every critical asset is monitored individually. The operations center doesn't get "storm in the Southeast". It gets "span 47 of the 500 kV Itaberá-Ivaiporã line, 82% lightning-strike risk in the next 4 h" or "feeder C-87 at high risk of falling trees in the next storm".
- Hyperlocal
- Per span, feeder and substation
- 1 km to 3 km resolution

Crews staged before the interruption
Outage probability per segment, feeder or substation with a lead-time window of days. This lets you stage maintenance crews before the interruption and cut restoration time.
- Preventive staging
- DEC/FEC
- Restoration

Straight into the operations center, no interpretation along the way
Integration via API, WhatsApp, Teams, SMS and email. The operator doesn't get a rain map. They get which asset is at risk, when the event is expected to occur and which protocol to trigger.
- API
- Teams
- Protocols by alert level
The next interruption costs more than anticipating it.
You can't control the weather, but you must manage the risks
Transmission operator
When the warning comes before the outage, the crew is already in the field
−35%
in average restoration time after weather events
Before, crews were mobilized after the outage. With hyperlocal alerts per span, feeder and substation, the operations center began staging teams before the event. This cuts DEC, slashes emergency costs and protects regulatory indicators.
Questions we hear before every decision
The next interruption costs more than anticipating it.
You can't control the weather, but you must manage the risks
Transmission lines, feeders, substations, towers and critical equipment are registered as monitored assets, with coordinates and operational rules. The model crosses hyperlocal forecasting at 1 km to 3 km, event history and the operations center's triggers to generate dedicated alerts per asset.
It depends on the phenomenon:
- Lightning strikes: 1–6 h
- Severe storms / accumulated rain: 12–120 h
- Cold fronts, wildfires: 3–7 days
- Nowcasting (lightning, wind bombs): 15 min–2 h
Yes. The 100+ generated scenarios have a spatial resolution between 1 km and 3 km. You define what's critical, such as a span, feeder, substation, tower or network segment, and receive individual alerts per asset.
Yes. We deliver alerts via REST API, WhatsApp, Teams, SMS and email. For legacy systems (SCADA, SAGE, OMS), we configure custom webhooks during onboarding.
4 weeks, in 4 stages:
- Mapping of critical assets (lines, substations, spans, towers)
- Calibration with the client's outage history
- Configuration of alert levels, channels and recipients
- Training of the operations center with protocols by alert level
Yes. That's exactly where we add the most value. We don't depend on ground stations. We combine a numerical model (WRF), 10 years of proprietary reanalysis and AI models (AFNO/FourCastNet) to generate hyperlocal forecasts at any point.
We cross hyperlocal forecasting, the segment's impact history and the client's operational thresholds. The result is a calibrated probability per asset: "500 kV Itaberá-Ivaiporã line, span 47: 82% strike risk in the next 4 h."
Lightning strikes · fires and wildfires · windstorms and gusts · severe storms · heavy rain · hail · heat waves · fog · extratropical cyclones.
Yes. The Resolution requires a contingency plan with mandatory climate and weather monitoring, early resource mobilization and communication within 15 minutes. i4cast delivers exactly that: alerts per asset with lead time, an evidence trail for reports and structured data to feed the reports required by ANEEL.
Yes. Wildfires are the second leading cause of transmission-line outages (16% of the total over the last decade). We monitor fire-risk indices based on temperature, humidity, wind and hotspot history. The crew receives alerts per transmission-line segment before the fire approaches the corridor.
- 100+ AI scenarios
- Risk language
- Evidence trail
The cost of i4sea's climate monitoring is a fraction of the loss from a single unplanned outage. A single fine cost one distribution utility R$ 165 million because of a storm. The monitoring reduces energy unavailability by 35%. It's an investment, not a cost.
Three main differences: (1) 100+ AI scenarios at 1 km to 3 km resolution per asset, not a generic forecast by city. (2) We enter your process and the language of your operation. We deliver outage probability, not a rain map. The operator receives action, not raw data. (3) Evidence with an auditable trail per event for reports, DEC/FEC and regulatory compliance. Traditional providers deliver weather information. We deliver operational climate intelligence.